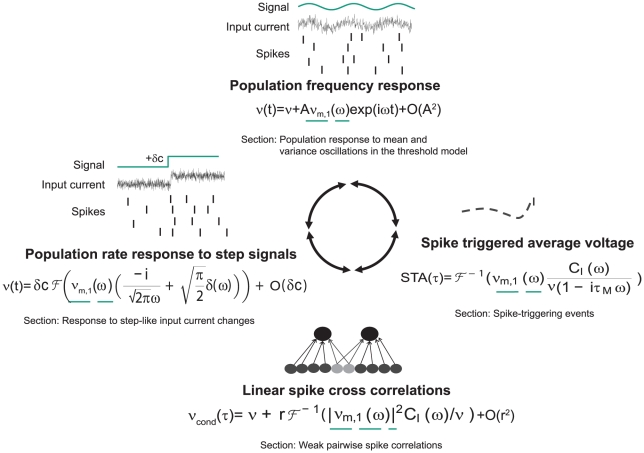
Figure 2. Computational role of mean-encoded signals.
(Top) Representation of periodic mean stimuli in the population rate of noisy, independent neurons. (Left) Representation of step-like mean signals in the population rate of noisy, independent neurons. (Bottom) Common fluctuating currents from presynaptic partners represent a common mean signal that leads to pairwise spike correlation function  . (Right) The average voltage before a spike is shaped by the linear mean response.
  denotes the input current correlation function. The role of the linear response function
  is indicated by a dashed green line. Results obtained in the alternative threshold model are discussed in the indicated Sections of this manuscript.

