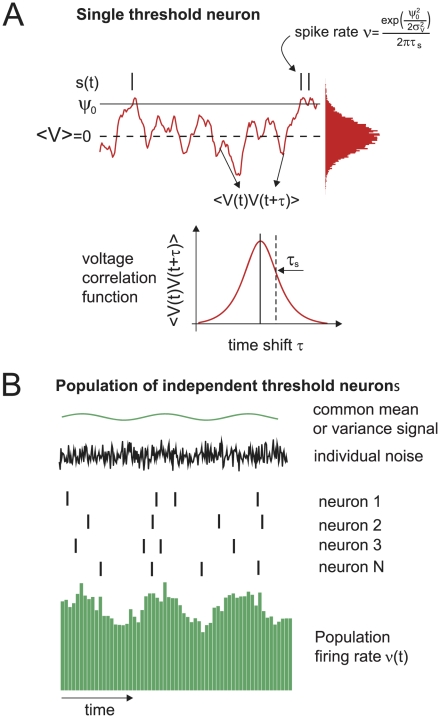
Figure 3. Spike generation and signal representation in the single spiking threshold neuron.
(A) Spike generation from a temporally correlated Gaussian voltage trace in a single threshold neuron. (B) Encoding of common signals by the population firing rate  of independent threshold neurons. Note, that
  can be either linearly related to the stimulus (linear regime for weak signals, Eq. 11, 12) or be described by a non-linear response function (e.g. see Eq. 20).

