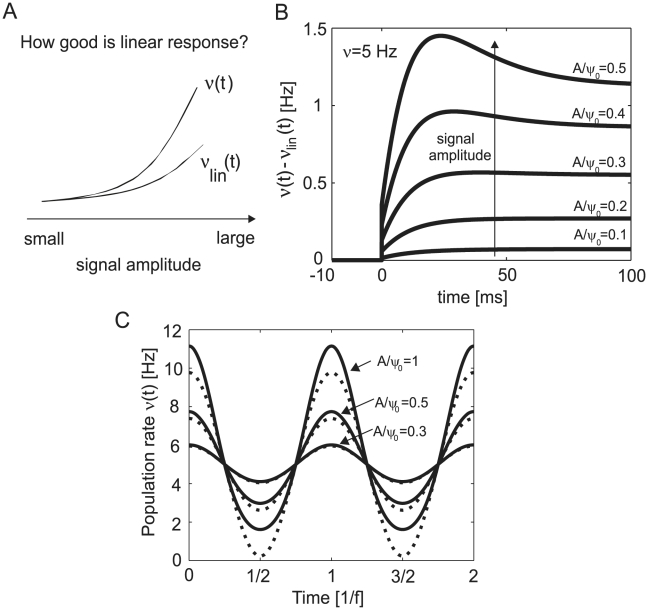
Figure 6. Fidelity of the linear approximation in relation to the complete non-linear response.
(A) Schematic illustration of how well the linear approximation of the population rate derived for low amplitudes (as in Eqs. 25,26) captures the complete response dynamics. (B) Differences in linear and non-linear population firing rate in response to mean current steps of different amplitudes. Here, the linear response corresponds to Eq. 25 and the non-linear response derives from Eq. 20; stationary firing rate  and
and  . (C) Differences between the complete population firing rate (solid line, Eq. 20) and its linear approximation (dashed line, Eq. 21) in response to periodic mean modulations of
  of different amplitudes. For an illustration of how the population dynamics
  emerges in response to a dynamic stimulus see Fig. 3B.

