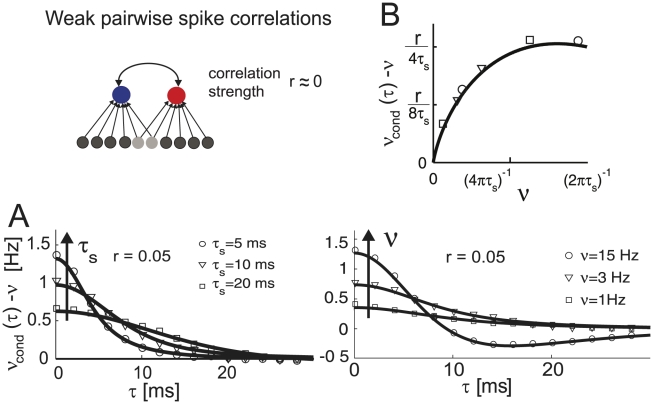
Figure 7. Weak spike correlations in the threshold model.
(Top) Illustration of spike correlations resulting from common input that are studied in A and B. (A) Cross conditional firing rate  vs. time
  in the limit of weak input correlations
  . Both neurons have the same voltage correlation function
  , firing rate
  . Fixed firing rate and varying correlation times
  (A, left) or fixed correlation time
  and varying firing rates
  (A, right). (B) Peak spike correlation
  as a function of firing rate
  . Symbols denote the corresponding peak spike correlations from (A).

