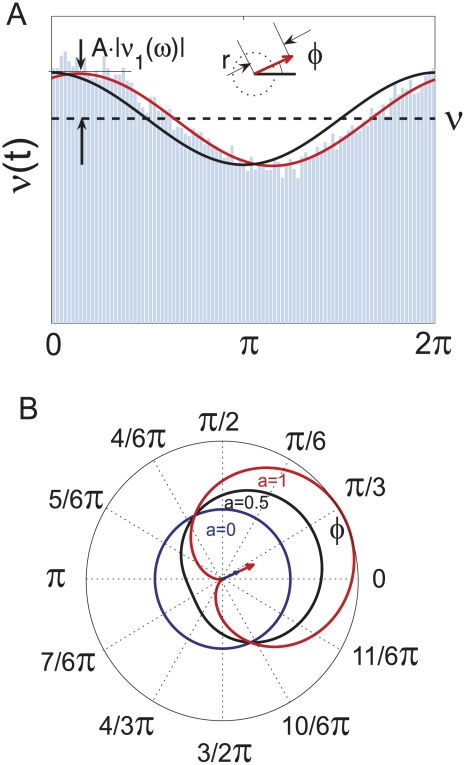
Figure 9. Demonstration of population firing rate modulation and phase locking.
(A) Simulated population firing rate  for mean current modulation for
  ,
,  ,
,  and
and  , time bin
  . This results in
  ,
,  and in the amplitude of the firing rate modulation of
  . Solid lines denote the envelop of
  (red) and the current modulation (black). Black and red arrows indicate the phase relation between the input current and the evoked firing rate response. (B) Theoretical distribution of phase lags
  for varying modulation depth
  , for illustration we chose
  (from (A)). The solid curves are the distribution envelop for
  (red),
  (black),
  (blue). The arrows indicate the corresponding mean phase
  .
.

