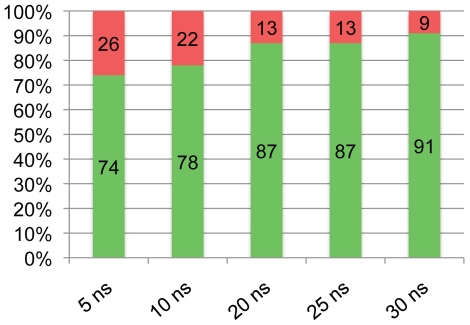
Figure 3. Time evolution of the predictive ability of flexibility metric during molecular dynamics (MD) simulations.
Shorter segments of MD trajectories were analyzed in order to find out the predictive ability of the flexibility metric in terms of discriminating between the functional and nonfunctional forms of p53 mutants. The percentage of succesful predictions using the number of clusters metric for the p53 mutants calculated at each of 5, 10, 20, 25 and 30 ns of MD simulations are plotted in the form of a column graph. The green and red column bars at each MD segment represents the percentage of successful and unsuccessful predictions, respectively. The exact percentage values are printed in each column bar.

