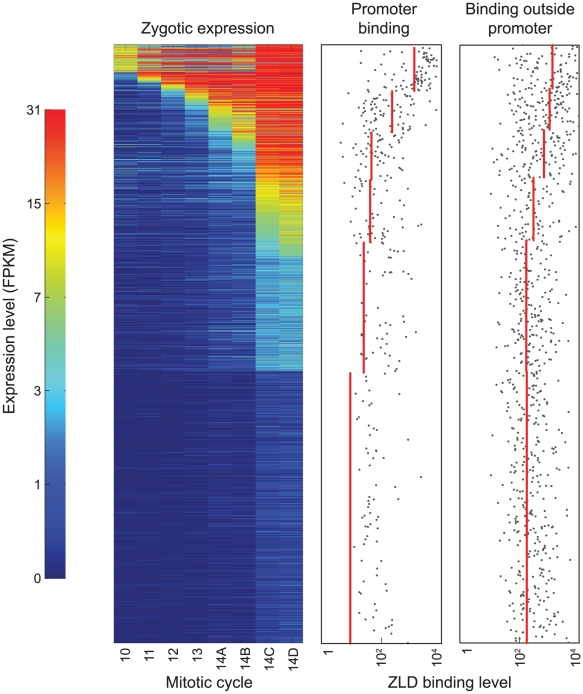
Figure 3. At mitotic cycle 8, ZLD marks promoter and non-promoter regions of genes activated at the MZT.
The left panel shows the expression patterns of 2,010 genes with exclusively zygotic expression at eight timepoints before and during the MZT (list of zygotically transcribed genes and expression data from [17]). Genes are sorted from early (top) to late (bottom) onset of zygotic transcription. The two panels on the right show the levels of ZLD binding to promoter and non-promoter regions for each gene (grey dots; regions with no detected binding are not plotted). Red lines show average levels of ZLD binding in groups of genes with similar times of transcription onset.

