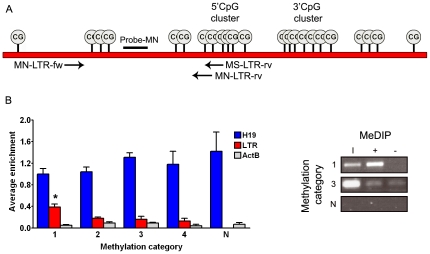
Figure 1. LTR methylation analysis.
(A) Overview of the methylation specific PCR (MSP) approach. Depicted is a schematic representation of the Gr1.4 MuLV LTR, containing 23 CpGs. The MSP was performed, after bisulphite treatment, with a methylation neutral forward primer (MN-LTR-fw), and a methylation specific (MS-LTR-rv) or neutral (MN-LTR-rv) reverse primer. Amplification products were quantified using methylation neutral probe-MN. Tumor samples were divided into 4 equal groups based on the methylation status of their LTRs (1 = highest LTR methylation level, 4 = lowest LTR methylation level). (B) Left panel. For H19, the LTR and ActB, average enrichment after MeDIP compared to input levels were calculated for each MSP-defined methylation category as well as for normal bone marrow, spleen and liver (N). In category 1 to 4 respectively 18, 15, 4 and 3 samples were analysed; error bars indicate standard deviations. P-values were calculated using a Wilcoxon test; *significantly higher than other categories, p-value <0.001. Right panel. Example of LTR enrichment after MeDIP (I = input, + = IP with anti-5-methylcytidine, − = IP with pre-immune serum IgG, 1 and 3 = methylation categories, N = normal spleen).

