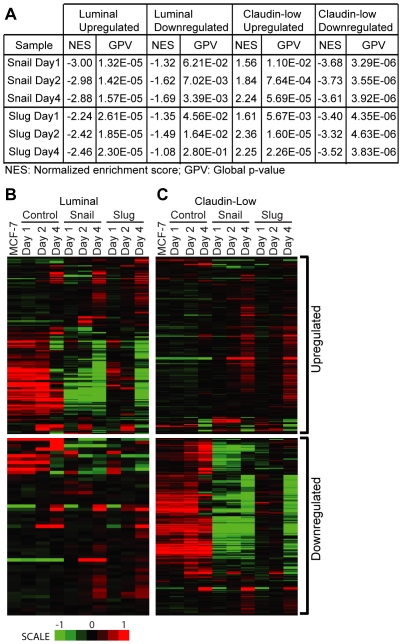
Figure 2. Snail and Slug cause changes in expression that most resemble the claudin-low class of breast tumors.
GSEA analysis (A) comparing the genes in the microarray samples to those that were upregulated (B and C, top panels) or downregulated (B and C, bottom panels) from the claudin-low class (B) and luminal class (C) described in [24]. See text for details. NES = Normalized enrichment score, GPV = Global p-value.

