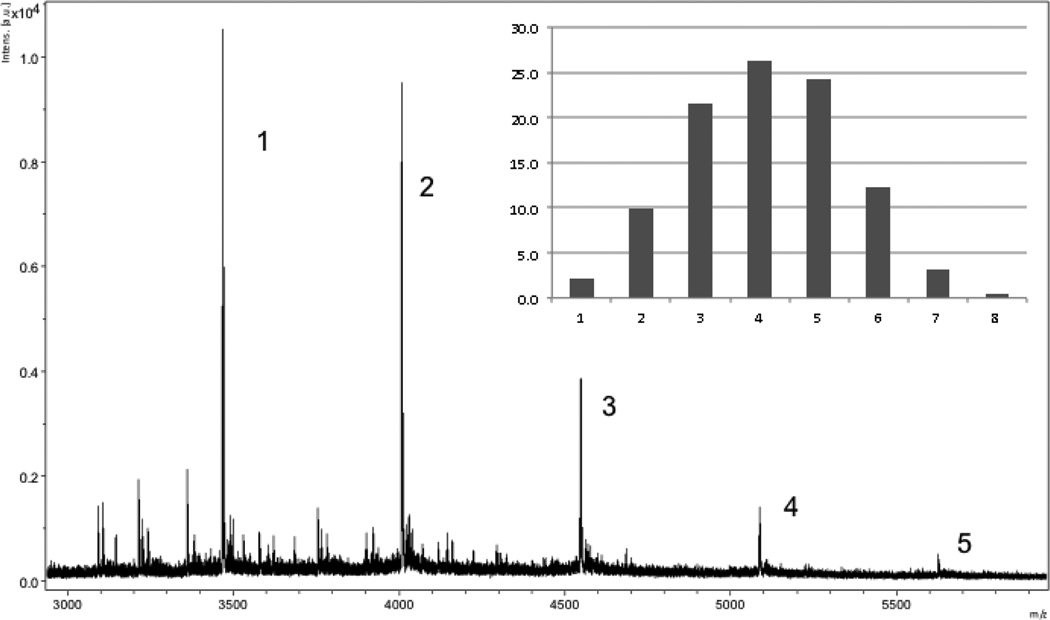
Figure 3.
MALDI-TOF mass spectrum of 14e showing the distribution of products. The numbers indicate the number of attached MSH4 ligands. The insert shows the anticipated statistical product distribution assuming attachment of 4.1 ligands per scaffold. For peak identification and for spectra of 13, 14a–14e, and 15a see the Supplementary Data.

