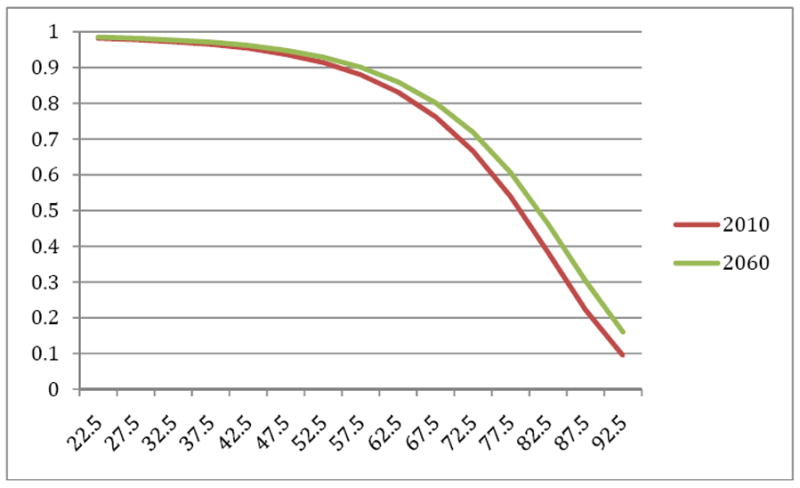
Figure 3. Survival Curves for Age 20+; Assumed for 2010 and 2060.

Notes: Results of simulation described in text and Appendix. Assumed 2010 survival curve is equal to the 2004 Vital Statistics survival curve; thus both may be understated. Life expectancy is simulated to rise from 79 years to 80.8 years.
