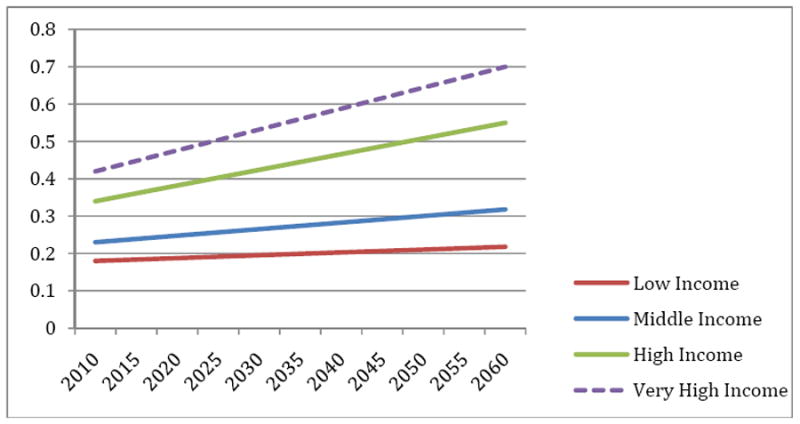
Figure 5. Predicted Marginal Tax Rates by Income Group Under Income Tax Increases (Scenario 1), 2010-2060.

Notes: Results of simulation model. The marginal tax rates increase so as to raise 8% of (baseline) GDP in additional revenue for the funding of public health care spending. The share of taxes paid by the top two groups combined, and each of the lower two groups, is held constant.
