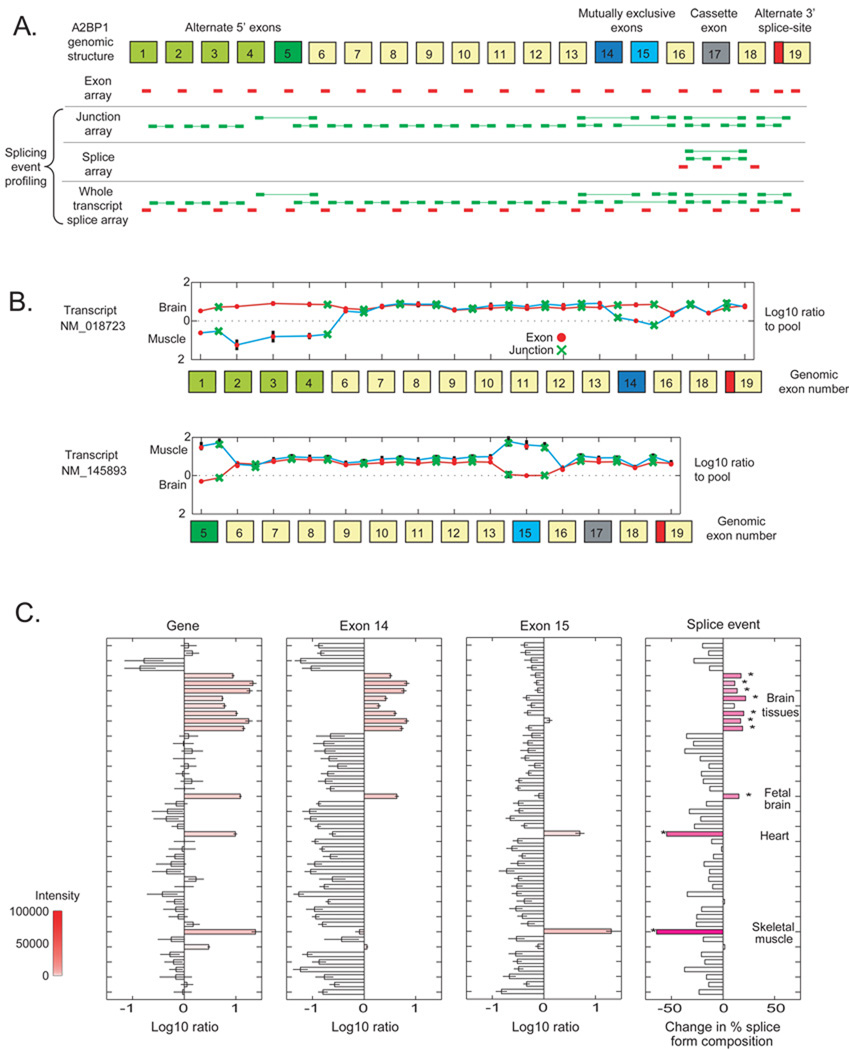
Figure 1.
Interrogation of A2BP1 (Fox-1) isoforms on the alternative splicing microarrays. A) The nineteen exons in the locus, including alternative 5' exons (green), mutually exclusive exons (blue), a cassette exon (gray), and an alternative 3' splice site (red). Exon (red) and exon-exon junction (green) probes are displayed for several splice-related microarrays. B) Expression (log10 fold-change to reference pool) of exons (red dots) and junctions (green crosses) in transcripts NM_018723 and NM_145893 in skeletal muscle (cyan line) and brain (red line). C) Expression of the gene, exon 15, exon 14, and the combined splice event expression level. Red shading represents microarray intensity values; dark pink shading (right) represents more significant p-values.

