Figure 2.
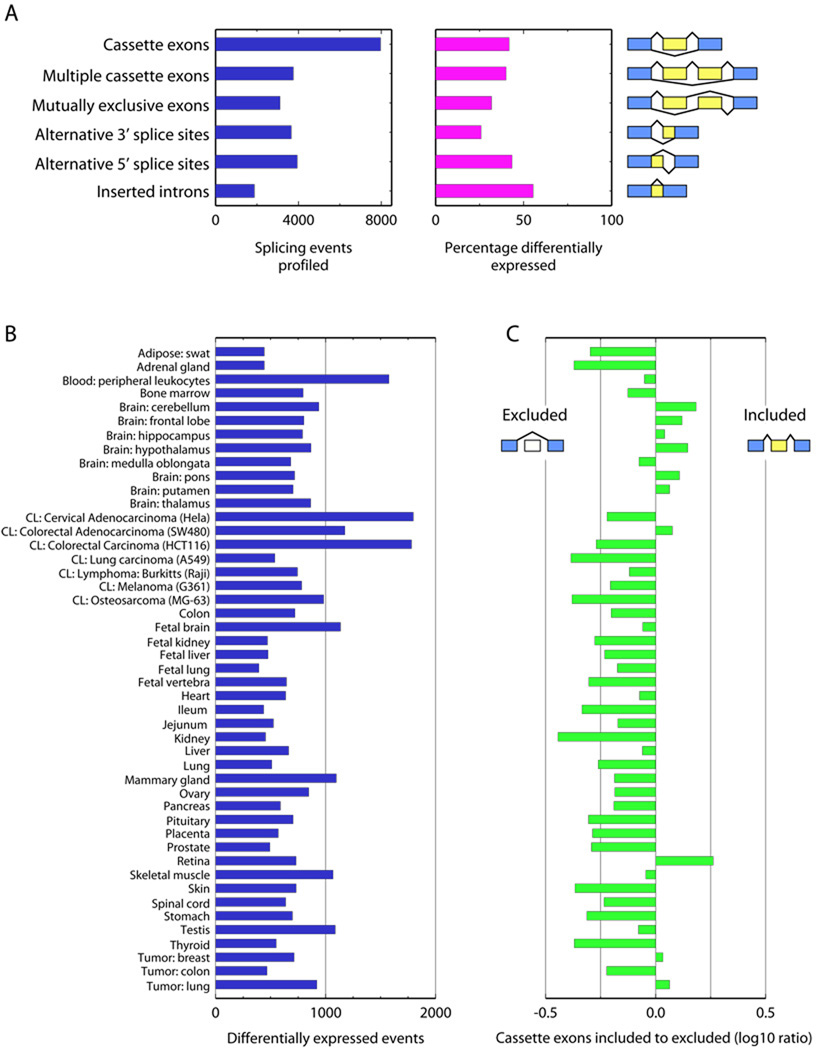
A) The number of events monitored on the arrays and the percentage of each type differentially expressed in at least one tissue. B) The number of events differentially expressed in each tissue. C) The log10 ratio of the number of cassette exons differentially included to those differentially excluded.

