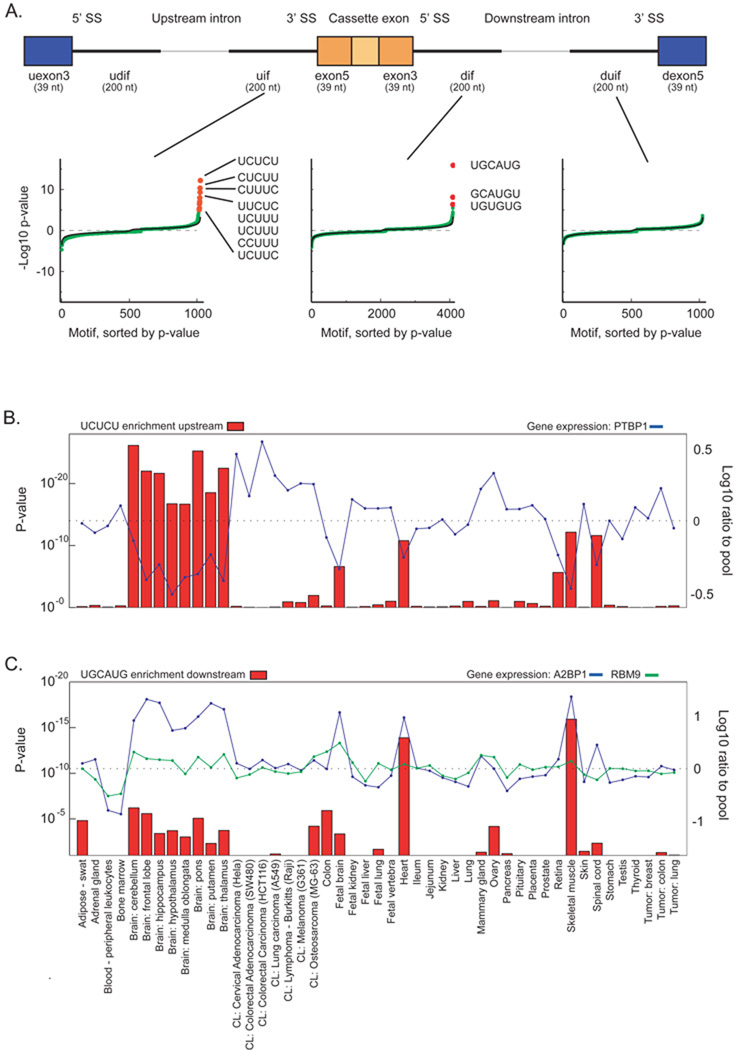
Figure 4.
A) Identification of alternative splicing motifs enriched in eight regions adjacent cassette exons upregulated in skeletal muscle. Abbreviations: exon5 (exon3), 5' (3') portion of cassette exons; uif (dif), intronic fraction upstream (downstream); uexon3 (dexon5) and udif (duif) are the corresponding regions adjacent the upstream (downstream) exons. Sorted pentamer and hexamer enrichment in three exemplary regions are shown. Green points are −log10 p-values; magenta points are those with a Bonferroni-corrected p-value less than 0.01. Positive (negative) p-values indicate motif enrichment (depletion). The black line represents the average of 200 randomized runs. B) Enrichment of UCUCU in human tissues and cell lines. Left axis: enrichment of UCUCU in the 200 nt upstream of upregulated cassette exons. Right axis: gene expression of PTBP1. C) Enrichment of UGCAUG. Left axis: enrichment of UGCAUG in the 200 nt downstream of upregulated cassette exons. Right axis: gene expressions of Fox proteins A2BP1 and RBM9. Displayed p-values are not Bonferroni corrected.

