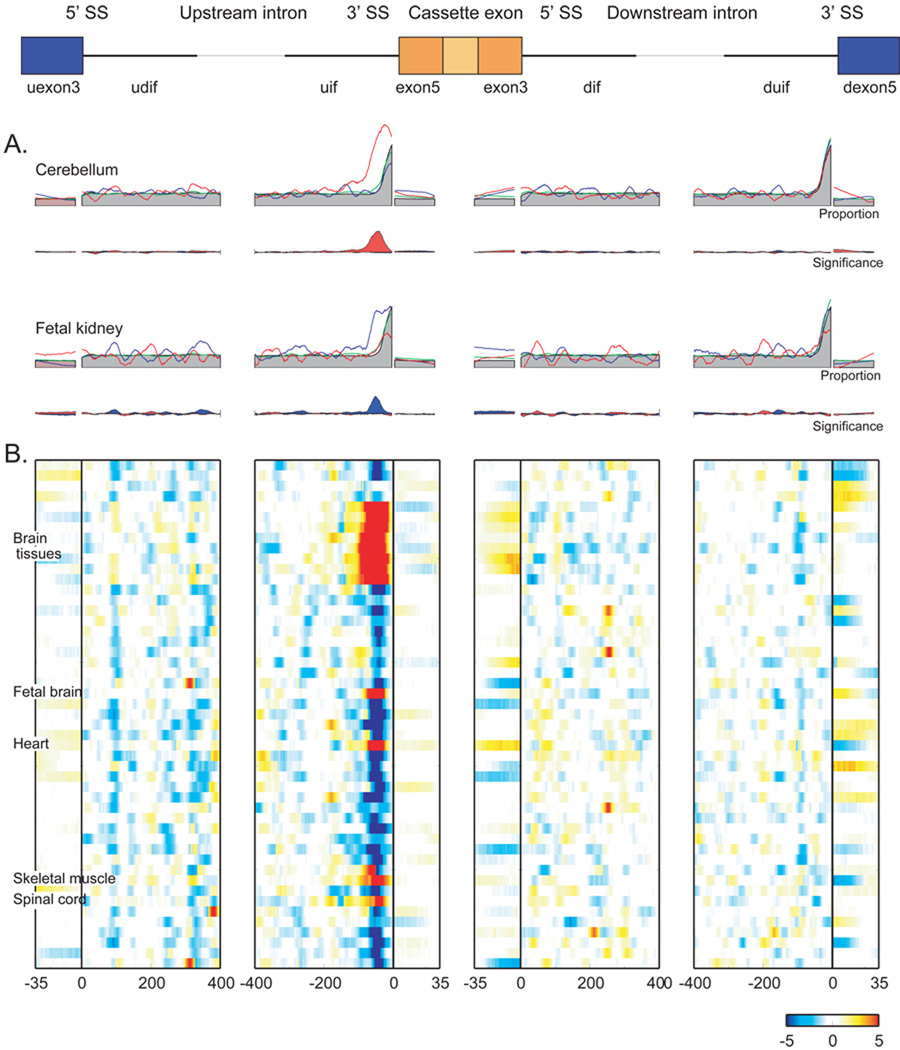
Figure 8.
Higher resolution enrichment of UCUCU adjacent regulated cassette exons. A) Smoothed fraction of the cassette exons with UGCAUG in cerebellum (upper) and fetal kidney (lower). Red, upregulated cassette exons; blue, downregulated; green, all monitored exons; filled gray regions, RefSeq exons. Maximum significance in cerebellum/uif is p-value < 1e-22; maximum proportion is 52. B) Hypergeometric probability (−log10 p-value) for up- and down-regulated exons relative to all monitored exons. At each point, the most significant p-value associated with either up or down regulated exons is shown. Samples are ordered alphabetically as per Figure 5.

