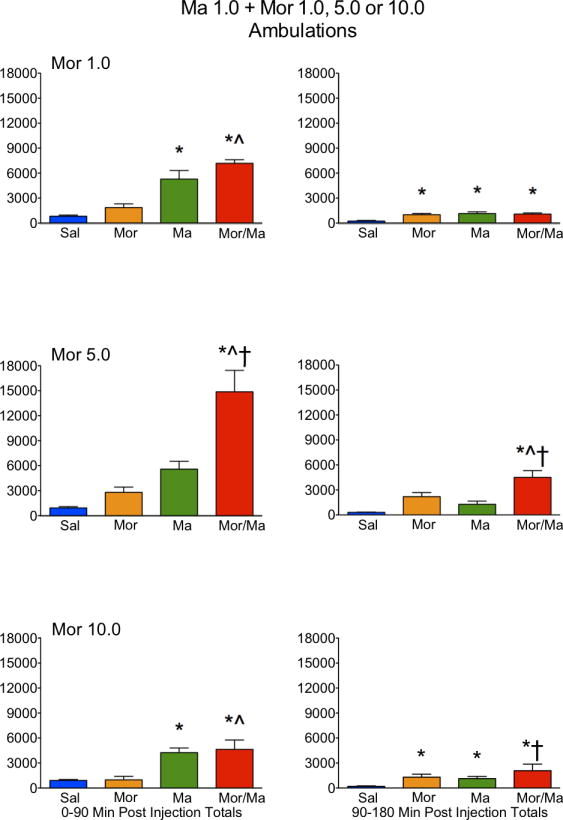
Figure 6.

Locomotor activity, as expressed in ambulations, in rats treated with saline (Sal), methamphetamine (Ma; 1.0 mg/kg), morphine (Mor; 1.0, 5.0 or 10 mg/kg s.c.) or the combination of Ma and Mor. Left panels = total ambulations during the first 90 minutes post-injection. Right panels = total ambulations during the second 90 minutes post-injection. *=significantly different from Sal; ^=Mor/Ma significantly different from Mor alone; †=Mor/Ma significantly different from Ma alone.
