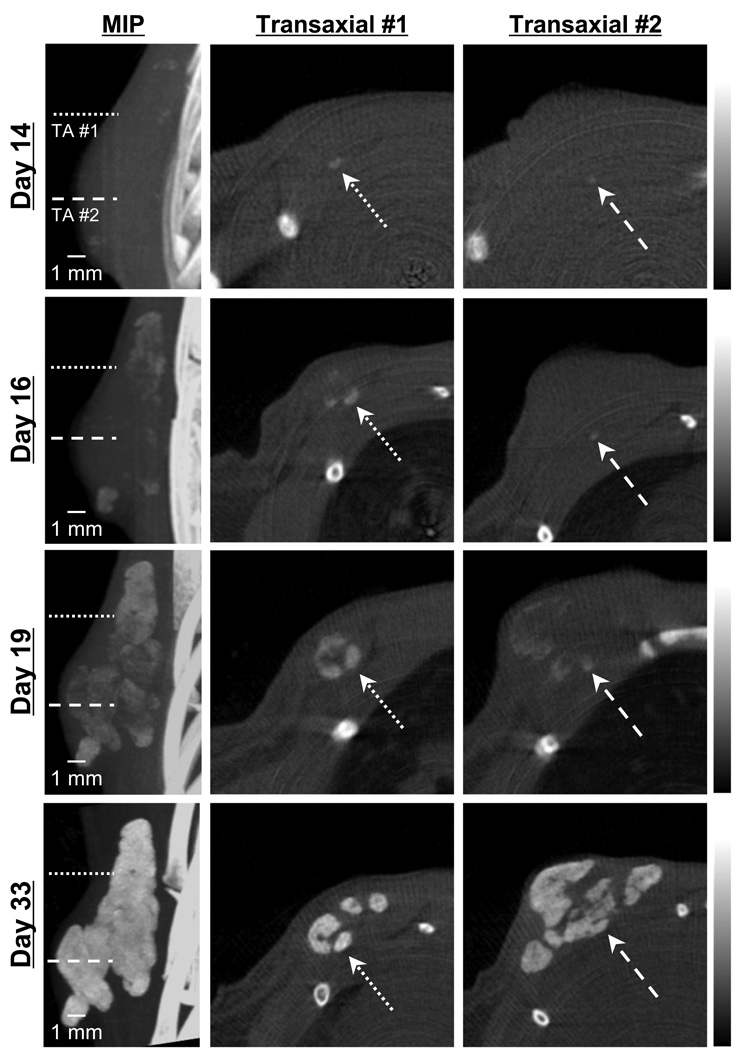
Figure 6. In Vivo Imaging of the Genesis and Growth of Breast Cancer Microcalcifications over Time.
High-resolution CT scanning of a syngeneic rat breast cancer at days 14, 16, 19, and 33 days post-injection with rBMP-2. Shown are the maximal intensity projection (MIP; left) and two transaxial (TA) slices (middle and right) whose positions are indicated with dotted and dashed lines on the MIP. Arrows indicate 300 µm (TA #1) and 100 µm (TA #2) microcalcifications first seen at day 14, which grew over time. CT acquisition parameters included: 45 kVp, 177 µA current, 3000 ms/projection, 360 projections/rotation, and a detector pixel size of 48 µm. Reconstruction parameters included the ECBA algorithm with a sampling number of 6 (ECBA-6) and a voxel size of 50 µm. Data are representative of n = 3 independent experiments.

