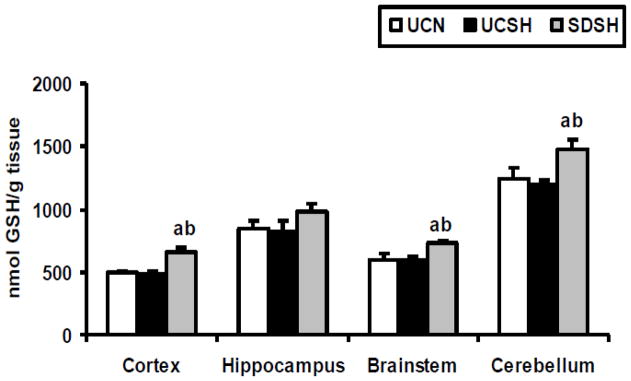
Fig. 2. Changes in Total Glutathione (GSHt) Levels.
Changes in total glutathione (GSHt) levels in the neocortex, hippocampus, brainstem and cerebellum of rats exposed to sleep deprivation under sustained hypoxia (SDSH) versus control animals left undisturbed under either sustained hypoxia (UCSH) or normoxia (UCN). Data are expressed as mean ± S.E.M. a= SDSH vs UCSH, p<0.05; b= SDSH vs UCN, p<0.05

