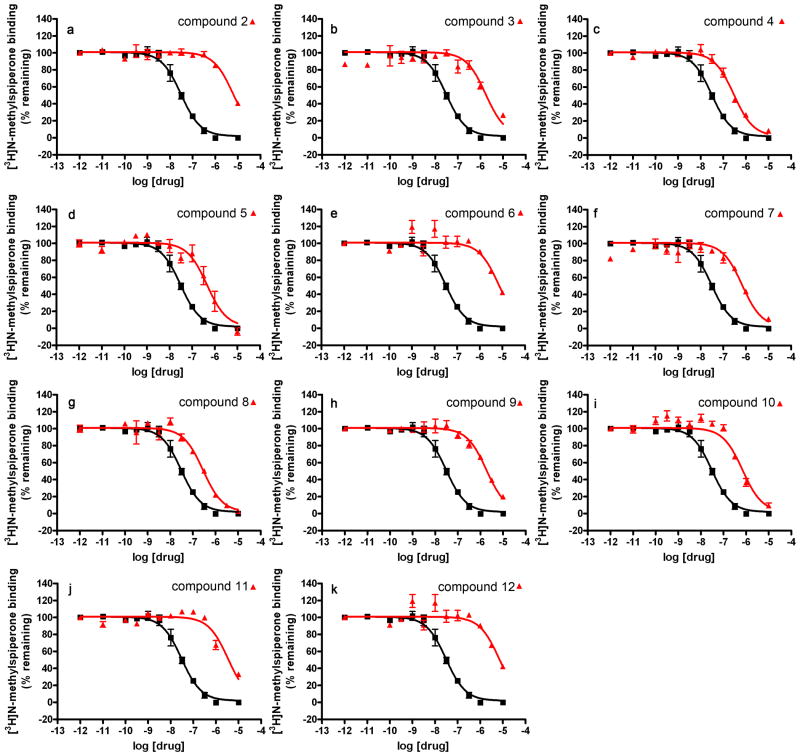
Figure 3. Dose-response curves of discovered ligands.
Representative radioligand ([3H]N-methylspiperone) competition binding isotherms for compounds 3, 4, 7, 28, 30 and 31 (a-f). Data for a reference compound (chlorpromazine, black curve) are shown along with data for the test compound (red curve). Assays are performed using a final radioligand concentration between (0.5 × KD) and (1 × KD), where KD equals the radioligand dissociation constant, which is determined for each crude membrane preparation by radioligand saturation binding analysis. Data represent mean values ± standard error, performed on triplicate experiments.

