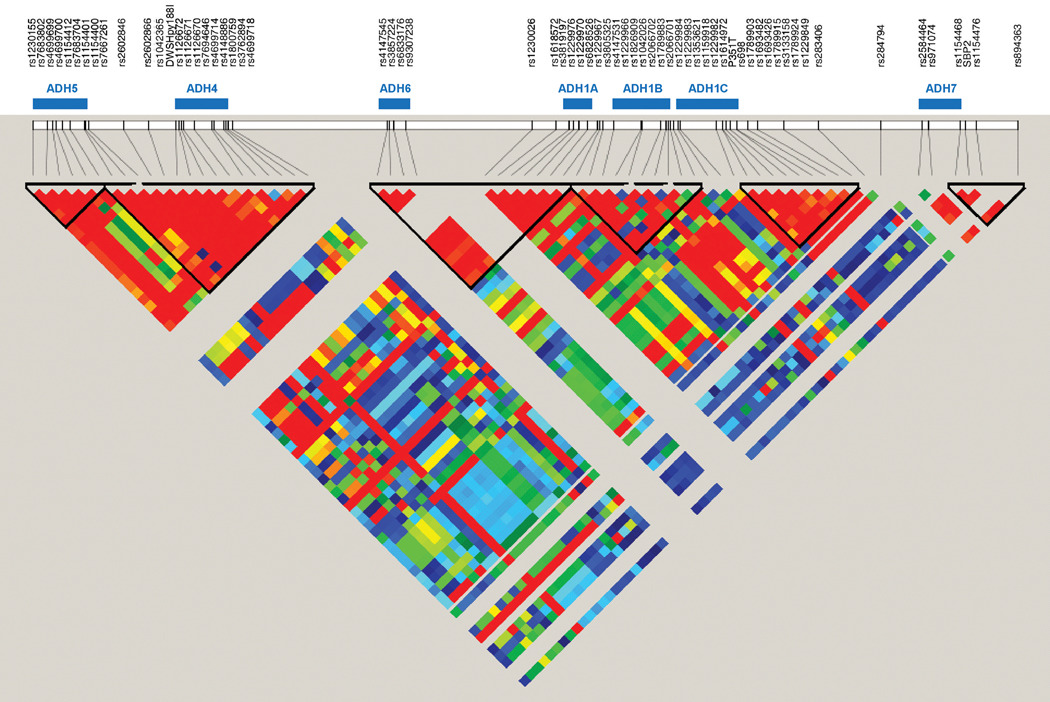
Figure 1.
Linkage disequilibrium (LD) between SNPs genotyped across the chromosome 4q ADH gene cluster. Gene locations are indicated by the blue bars. Absent or low levels of LD are indicated by the blue and green squares, respectively, whereas increasing levels of LD are indicated by the yellow, orange, and red squares in ascending order of LD.

