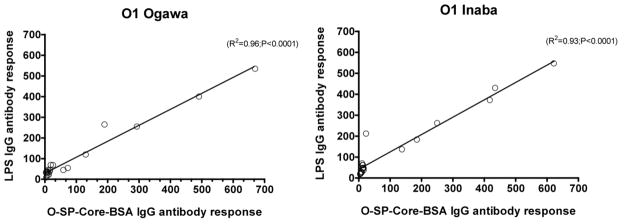
Fig. 5.
Correlation between anti-V. cholerae O1 LPS IgG antibody responses and corresponding O-SP–core–BSA IgG antibody responses. Lines designate the linear correlations between the responses. Antibody responses were assessed for 10 patients with Ogawa (left panel) and 10 with Inaba (right panel) during the acute and convalescent phases of infection.

