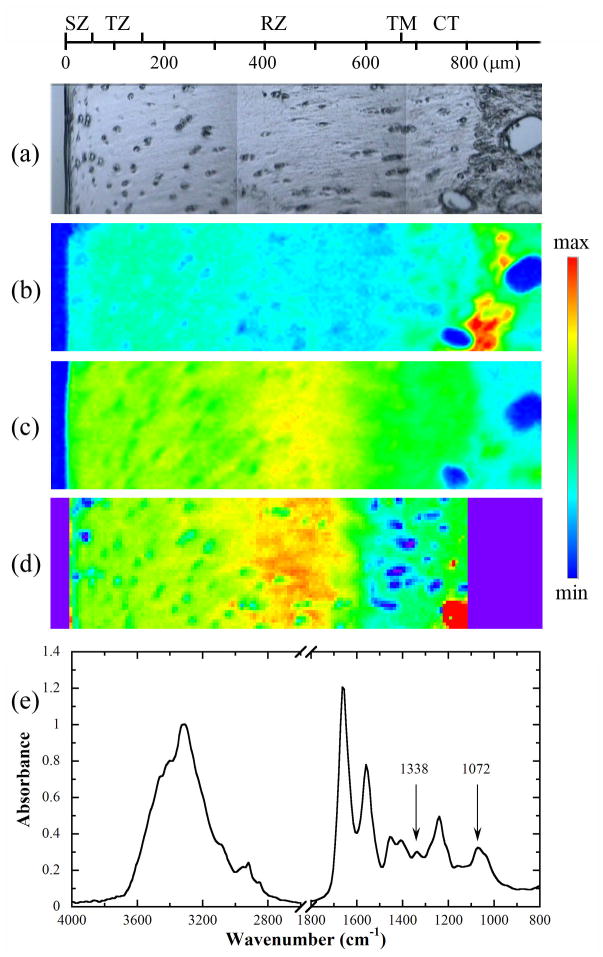
Fig 1.
(a) A visible image of a cartilage section, and the corresponding chemi-maps of (b) 1338 cm−1 and (c) sugar bands, both obtained without an analyzer. (d) The PCR-calculated PG concentration map with the min and max of 10 and 32%. (e) A FTIR spectrum extracted from the cartilage section. The scale maxima for the 1338 cm−1 and sugar chemi-maps are 0.045 and 0.1, respectively; the scale minimum is 0 in both chemi-maps. SZ: superficial zone, TZ: transitional zone, RZ: radial zone, CT: calcified tissue, TM: tidemark.

