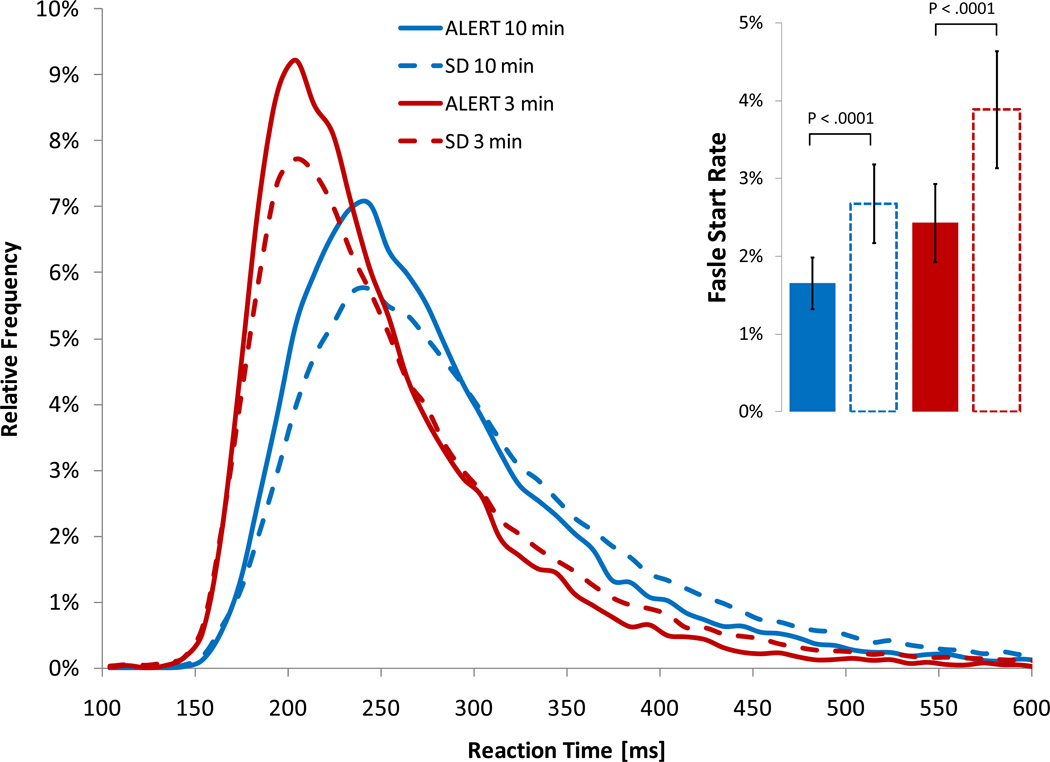
Figure 1.
Relative frequency distributions of PVT response time are shown for alert (bouts 1 to 7 during total sleep deprivation and baseline 2 during partial sleep deprivation) and sleep deprived states (bouts 8 to 17 during total sleep deprivation and restriction nights 1 to 5 during partial sleep deprivation) for both the modified 3-min (PVT-B) and the 10-min version of the PVT. The insert shows the frequency of false starts (errors of commission) including 95% confidence intervals.

