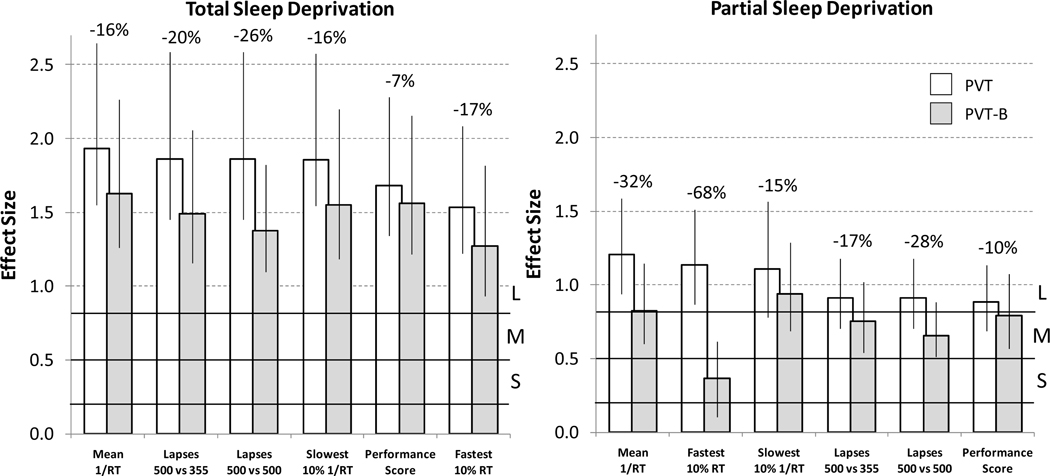
Figure 2.
Effect sizes ± 95% bootstrap confidence intervals are compared between the standard 10-min PVT (PVT) and the modified 3-min version of the PVT (PVT-B) for 5 outcome metrics and for both total (left) and partial (right) sleep deprivation. For PVT-B, both standard 500 ms and modified 355 ms lapse thresholds were applied. Ranges representing small (S, >0.2 and <0.5), medium (M, >0.5 and <0.8), and large (L, >0.8) effect sizes according to Cohen [41] are indicated by black horizontal lines. The relative decrease in effect size from PVT to PVT-B is indicated as percentages above each outcome metric.

