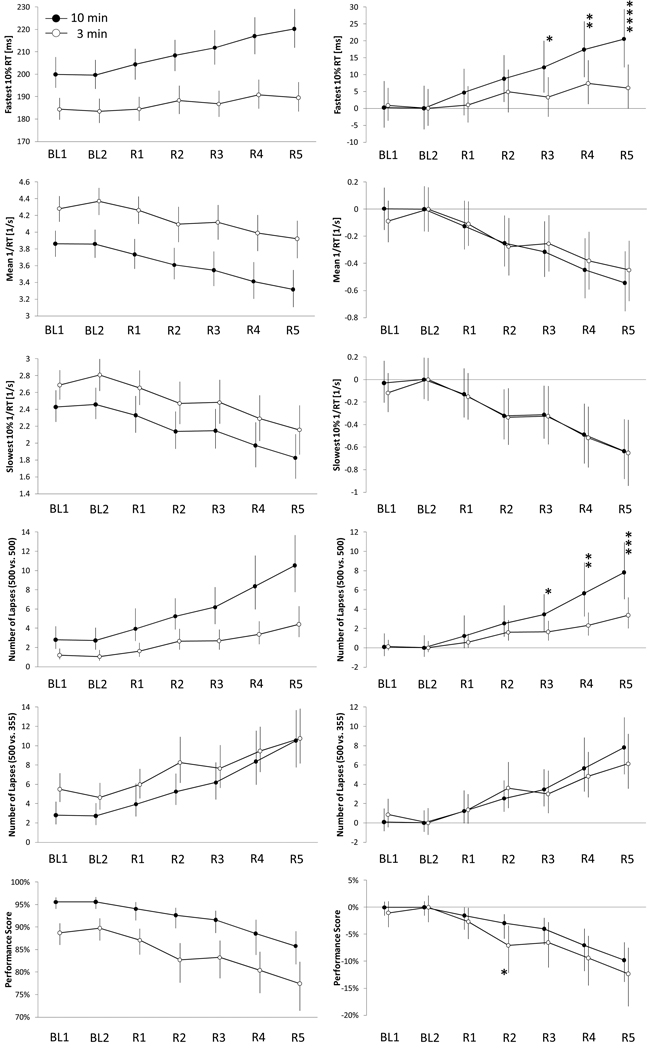
Figure 4.
For each of the 6 outcome variables, between-subject averages (N=43 subjects) are shown for each of the 7 conditions of the partial sleep deprivation protocol (BL = baseline, R = restriction) for both the modified 3-min PVT-B (open circles) and the 10-min PVT (black circles). Error bars represent 95% BCa confidence intervals based on a bootstrap sample with 1,000,000 replications. In the right column of the figure, the 5 outcome variables of the 3-min PVT-B and the 10-min PVT were centered around alert performance (BL2). Paired t-tests were performed on each of the five sleep restriction conditions (R1 – R5) to test whether the 3-min and the 10-min PVT differed statistically significantly. * p<0.05, ** p<0.01, *** p<0.001 (adjusted for multiple testing)

