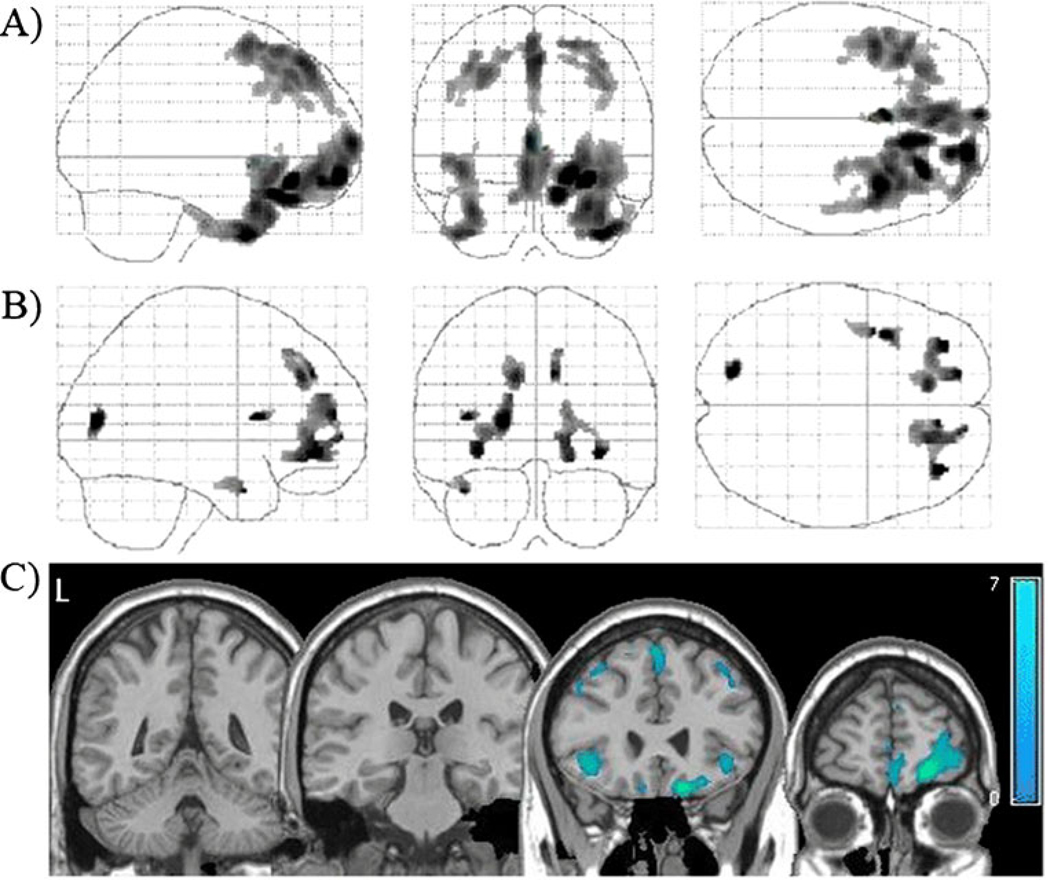
Fig. 3.
Tissue density in active cocaine users relative to cocaine abstainers. Locations with significantly lower gray matter (a) and white matter (b) densities in cocaine users relative to abstainers (p<0.001, corrected). These statistical gray and white matter maps have been superimposed to demonstrate the distribution of lower tissue density in the users (c). Color bar represents t values from the statistical maps

