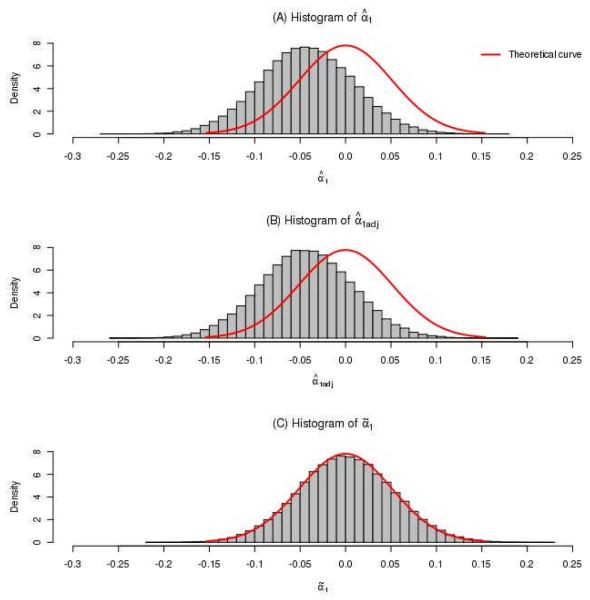
Figure 2.
Histograms of random variables , , and based on 100,000,000 replicates under the null hypothesis that there is no association between the SNP and the secondary phenotype (Figure 1 (A)). The theoretical curves were plotted following normal distributions, with a mean of 0 and the estimated standard errors of , , and , respectively.

