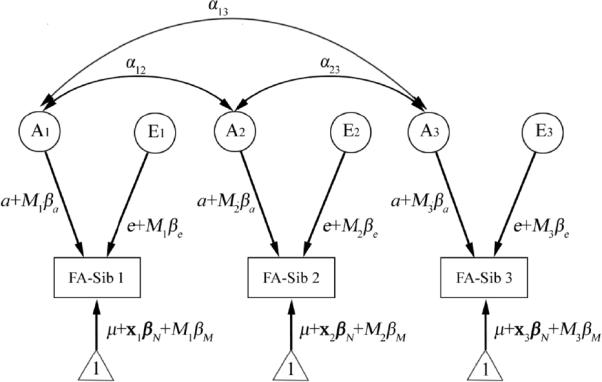
Fig. 1.

The path diagram for the “genetics plus moderator” model for an example family - in this case, with three siblings. Each sibling's phenotypic measure (e.g., FA in this study) is assumed to be determined by an additive genetic component (A), and an environmental component unique for each individual (denoted by E). Random noise, or experimental measurement error, is also included in the E component. Correlations between the genetic factors between siblings are indicated by double arrows. αij indicates the correlation coefficient, and is equal to 1 when siblings i and j are monozygotic pairs, and 0.5 when they are dizygotic pairs, a co-twin and a non-twin sibling, or two non-twin siblings. E components are assumed to be independent between siblings (no correlation). Interactions between genes and some specific demographic or environmental measure are modeled by including a moderator variable (denoted by M), e.g. age. Here, the contribution of component A or E to the phenotype, weighted by its path coefficient a or e, is assumed to be modified by the linear effect of moderator M, with the value of M in sibling i denoted by Mi. We also modeled the mean value of the phenotype, with a constant 1 (indicated by the triangles), modulated by the effects of the grand mean of the phenotype (μ), the nuisance covariates (x), and the moderator (the main effect of the moderator). Here variable x and its regression coefficient βN are bold-faced to denote vectors that allow more than one nuisance covariate. Modeling the means helps to remove the bias due to a possible correlation between siblings' phenotype and the moderator (Purcell, 2002), as we are more interested in the effect of the moderator on the genetic (A) and the environmental (E) influences. For simplification, all path coefficients, (a and e, and βa, βe, βN, and βM) are assumed to be the same between siblings.
