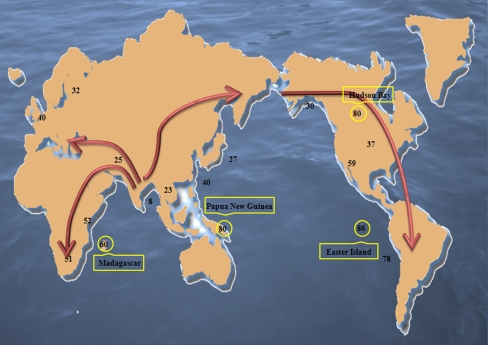
Fig. 1.
Map of Hp1 allele frequency. The numbers represent the Hp1 allele frequency (as a percentage). The arrows represent the direction of human migration in pre-historical times. Four exceptions on the normal Hp allele distribution with extremely high Hp1 allele frequencies are found around the Hudson Bay, Easter Island, Madagascar, and Papua New Guinea [Frederik Hendrik Island (West Irian)]

