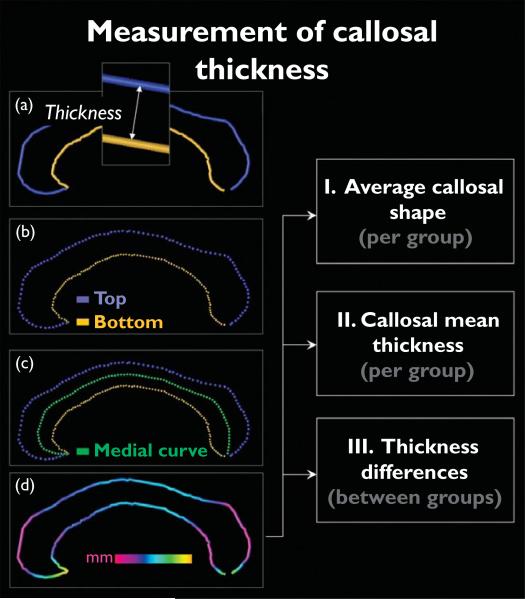
Fig. 1.
Illustration of callosal thickness measurements. Left panels (a–d): after delineating and redigitizing upper and lower callosal boundaries (top and bottom), we computed the spatial mean (medial curve) between points representing the top and bottom. The pointwise distances between medial curve (green) and callosal top (blue) and bottom (yellow) segments were calculated and superimposed as color-coded values onto each participant's callosal surface model. Right panels [I–III]: individual callosal surfaces and pointwise distance values were averaged within groups to create profiles of average callosal shape and maps of callosal mean thickness within groups, as well as significance maps representing regions in which groups differ with respect to callosal thickness.

