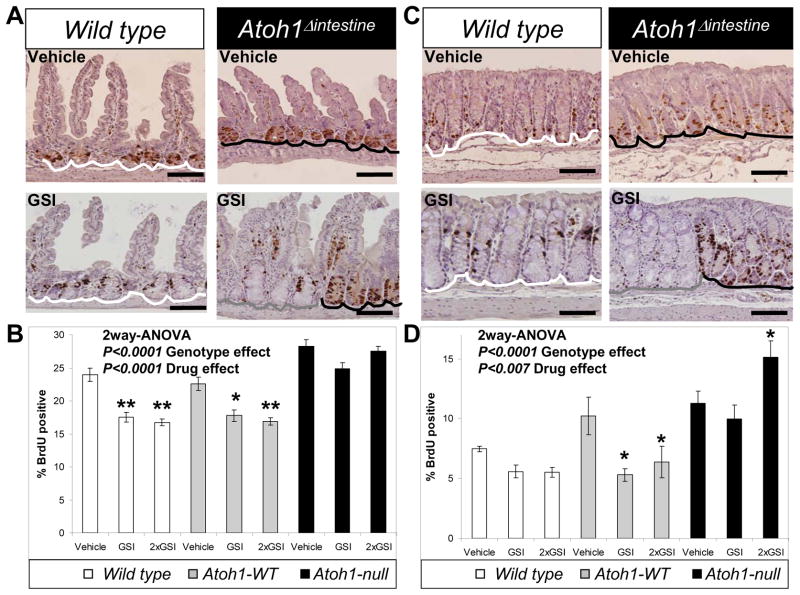
Figure 4. Atoh1 mediates GSI-induced growth inhibition in normal intestinal epithelia.
A) S-phase cells (marked by BrdU) were stained brown in ileal sections from Wild type and Atoh1Δintestine mice treated with vehicle or GSI (GSI-20, 10μM/kg twice a day for 5 days). White lines underline Wild type crypts form Wild type animals; grey line underlines Atoh1-WT crypts in Atoh1Δintestine mice and black lines underline Atoh1-null crypts in Atoh1Δintestine mice. B) Quantification of BrdU positive ileal cells from vehicle or GSI treated Wild type and Atoh1Δintestine mice. Animals were treated for 5 days with 10μM/kg once a day (GSI) or twice a day (2×GSI). The white, grey and black bars represent counts from different set of crypts as described in A. [Wild type animals: n=5 for vehicle, n=4 for GSI, and n=7 for 2×GSI; Atoh1Δintestine animals: n=4 for vehicle, n=8 for GSI, and n=5 for 2×GSI]. A significant difference in proliferation was measured for vehicle treated Wild type versus Atoh1-null crypts (p<0.01), and Atoh1-WT versus Atoh1-null crypts (p<0.001). C) Colonic sections from mice as shown in A. D) Quantification of BrdU positive colonic cells from mice as shown in B. [Wild type animals: n=3 for vehicle, n=8 for GSI, and n=6 for 2×GSI; Atoh1Δintestine animals: n=4 for vehicle, n=4 for GSI, and n=5 for 2×GSI]. (B and D) Error bars represent standard error of the mean. Significance was calculated using 2-way ANOVA for GSI and genotype effects. Bonferroni posttest analysis was used for calculating significance for individual groups. * p< 0.05, ** p< 0.001.

