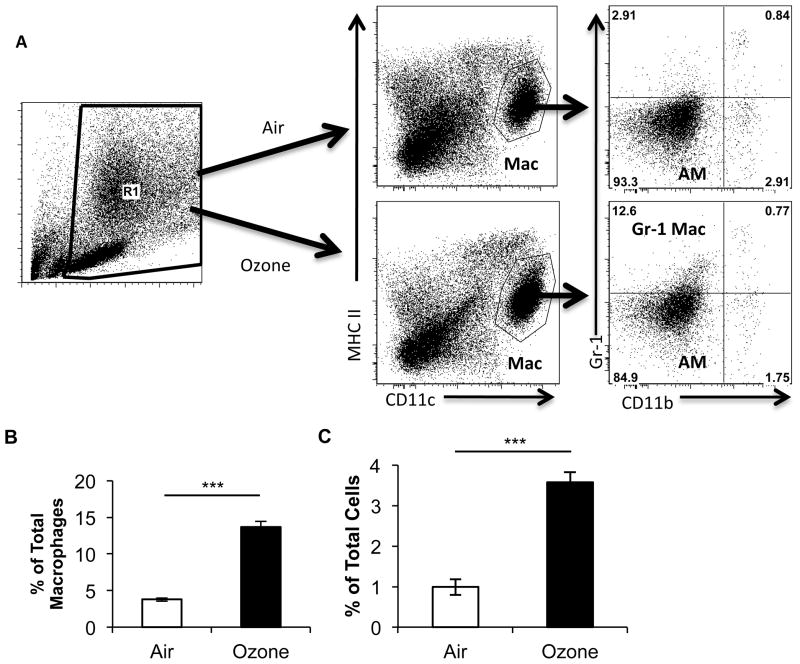
Figure 1. Flow cytometry of macrophages after ozone challenge.
A, Flow profile of total lung cells isolated 24 h after exposure to filtered air or 2ppm of ozone. Lungs are digested and then enriched for mononuclear cells over an 18% Nycodenz gradient. Flow cytometry was then performed. Live cells are gated on the basis of FSC and SSC (R1 Gate). The cells from R1 are analyzed by CD11c vs. MHCII expression to identify individual cell populations. Macrophages are identified as MHCIIint and CD11c+ (Mac). Subgate analysis from the Mac Gate by CD11b and Gr-1 after air exposure identifies macrophages as CD11blow Gr-1low (AM). After ozone exposure, in addition to CD11blow Gr-1low macrophages a population of CD11blow Gr-1high macrophages (Gr-1 Macs) develops. B, A graphic representation of the number of CD11blow Gr-1high macrophages as a percentage of total macrophages (defined as MHCIIint and CD11c+) after either filtered air or ozone. C, A graphic representation of the number of CD11blow Gr-1high macrophages as a percentage of total cells. The flow plots are from a representative sample of C57BL/6 mice given filtered air or ozone. Data were derived from 3–4 mice with both exposures and are representative of two separate experiments (***P<0.0005 between groups of Gr-1high macrophages in either air or ozone exposure groups).

