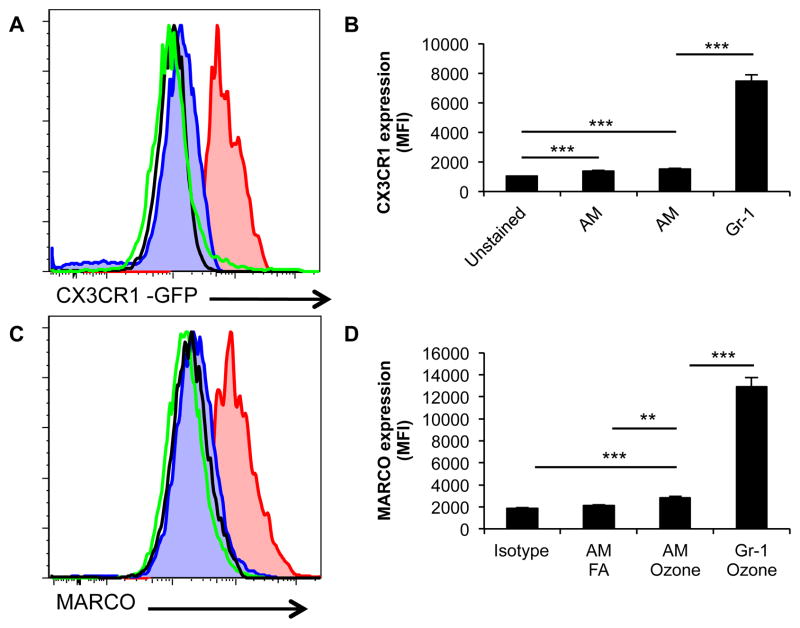
Figure 2. Cell surface expression of Gr-1high macrophages.
A–B, CD11blow Gr-1low and CD11blow Gr-1high macrophages are analyzed for cell surface expression of CX3CR1 using CX3CR1GFP/WT mice after ozone exposure. Gr-1 macrophages (Red) have enhanced surface expression of CX3CR1 as compared to AM (Blue) by histogram analysis (Fig. A) and mean fluorescent intensity (MFI) (Fig. B). Black open histogram represents unstained FITC channel autofluorescence and Green open histogram represents air exposed macrophages. C–D, Gr-1 Macs and AMs are analyzed for cell surface expression of MARCO. Gr-1 Macs (Red) have enhanced cell surface expression for MARCO by histograms (Fig. C) and MFI (Fig. D) as compared to ozone exposed AMs (Blue), isotype control (Black) and air exposed resident macrophages (Green). Histograms are a representative sample of C57BL/6 and CX3CR1GFP/WT mice. MFI data is generated from 4 mice with both FA and ozone exposures with two repeats (***P<0.0005).

