
Figure 4.


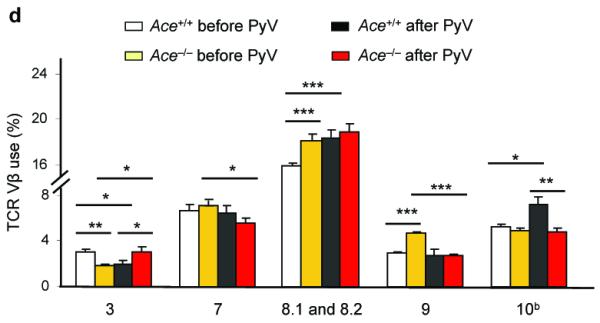
The effects of ACE on CD8+ T cell repertoire. (a) Female Ace+/+ mice were immunized with Mφ from either male Ace +/+ or ACE 10 mice. Splenocytes were expanded in vitro by stimulating with the indicated cells equivalent in ACE expression to the immunizing cells (booster). Restimulation (Restim.) consisted of either APCs loaded with the indicated HY peptides or with male or female Mφ equivalent in ACE expression to the immunizing cells. The percentage of IFN-γ secreting CD8+ T cells was measured. Right, representative histograms of the CD8+ T cell response. The immunizing cells are labeled at the top while the y-axis shows the restimulus. (b) Female Ace +/+ mice were immunized with Mφ from either male Ace +/+ or Ace −/− mice. The splenocytes were boosted and restimulated similar to panel a. IFN-γ secreting CD8+ T cells were measured. (c) Ace −/− mice were immunized, boosted and restimulated with Mφ from either Ace +/+ or Ace −/− mice of the same gender. IFN-γ secreting CD8+ T cells were measured. (d) TCR Vβ usage was measured in splenic CD8+ T cells before and after infection with polyomavirus (PyV). Vβ chains with different usage patterns between Ace +/+ and Ace −/− are shown. Data are the average of 6 Ace +/+ mice and 4 Ace −/− mice. *P<0.05; **P<0.01; ***P<0.005.