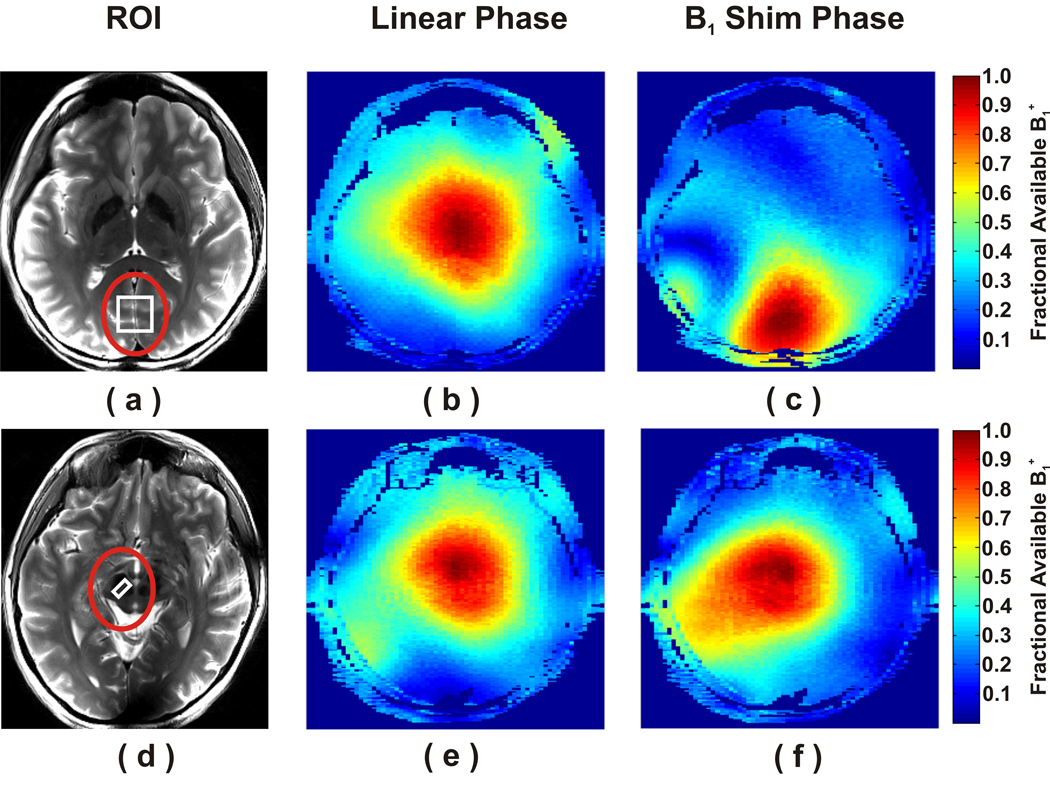
Figure 1.
Local B1+ shimming at the periphery (a) and center of one subject’s brain (d). The ROIs (red circles) were used to shim B1+ for the VOIs (white squares); (a) occipital cortex and (d) substantia nigra. Maps of the fraction of available B1+ before (b, e) and after (c, f) B1+ shimming are shown for the occipital cortex (b,c) and substantia nigra (e, f).

