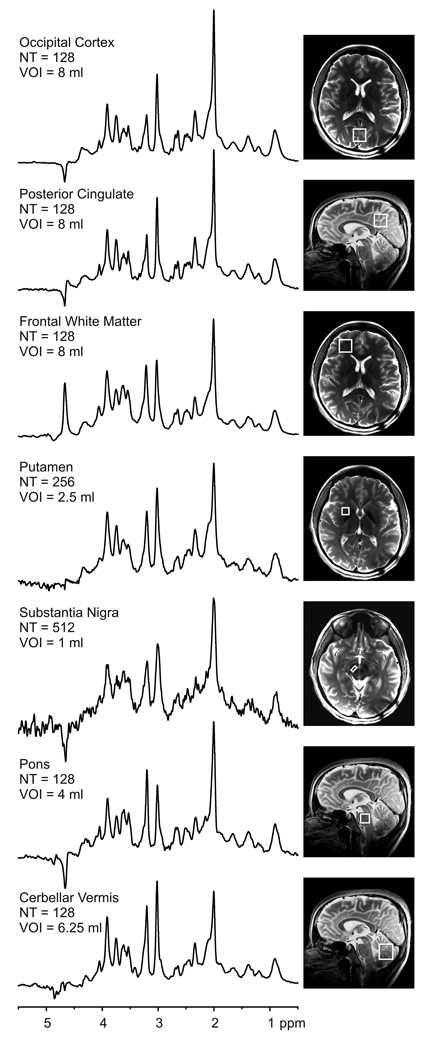
Figure 2.
1H MR spectra obtained with STEAM (TR = 5 s, TE = 8 ms, TM = 32 ms) from seven VOIs. The spectra were scaled based on neurochemical concentrations obtained by LCModel. Processing: Reconstruction of single scan FIDs from phased array data, frequency and phase correction of FID arrays, FID summation, correction for residual eddy current effects, Gaussian multiplication (σ = 0.1 s), Fourier Transform (FT), zero-order phase correction. Positions of the VOIs are shown on T2 – weighted images. (NT = number of transients)

