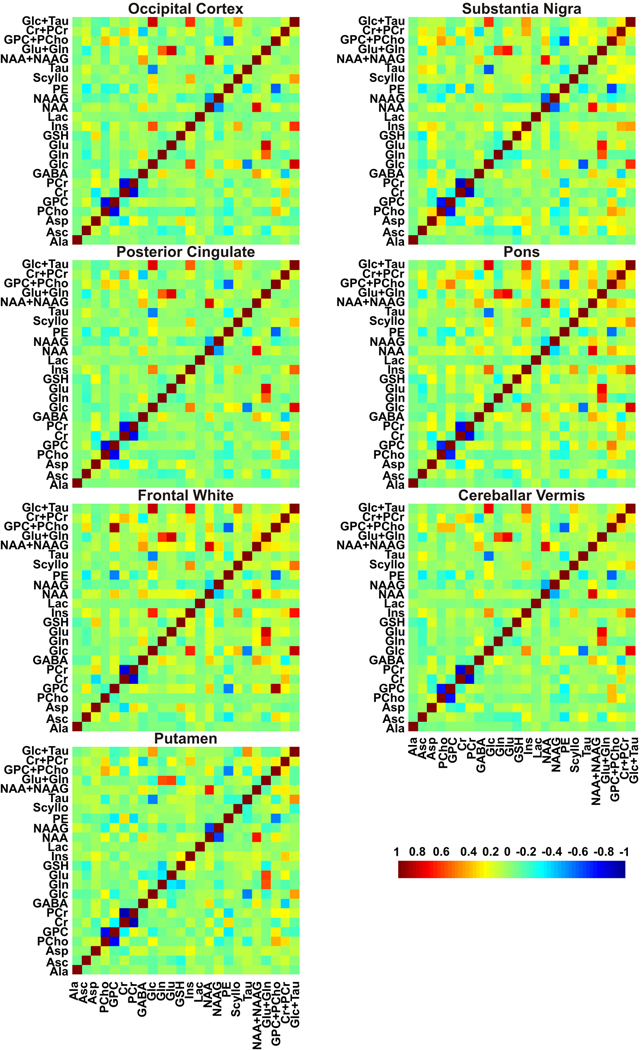
Figure 4.
Mean correlation coefficients matrices between the metabolite concentrations in different brain regions determined by LCModel fitting of short-echo STEAM spectra acquired at 7 T. Non-zero off-diagonal elements of the correlation coefficients matrices indicate the level of covariance between the fitting results for the corresponding two metabolites.

