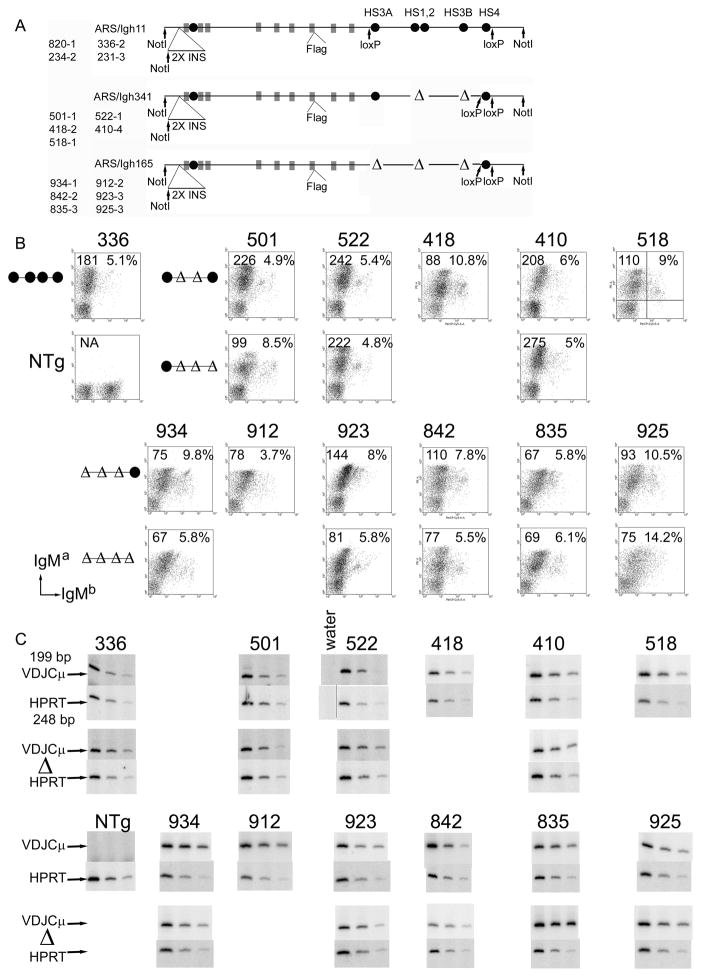
FIGURE 1.
Deletions of 3′ enhancers from a BAC containing the heavy chain constant region locus. A. Transgenic lines are listed to the left of schematics by their founder number, followed by a dash and the transgenic JH copy number of the line. Coding exons are depicted as grey boxes; enhancer elements are depicted as black circles. Insertion of two copies of the chicken β-globin insulator 3 kb 5′ of the VDJH2 exon and insertion of a 24 bp Flag tag-encoding element at the carboxy terminus of secreted γ2a are noted. Four bp insertions in the Iγ1 and Iγ2a regions are not shown (22). 1.1 to 1.3 kb deletions of enhancer elements are depicted as “Δ”s. HS4 is flanked by loxP sites, allowing its deletion by breeding with Cre-expressing transgenic mice. After Cre-mediated deletion, transgenic lines are designated by their founder number with a Δ. B. Analysis of cell surface transgenic IgMa and allelic exclusion by flow cytometry. Founder line numbers are shown above each panel. The composition of the 3′ enhancer region is shown schematically to the left of each set of transgenic lines. The mean fluorescence intensity of the IgMa positive cells is shown in the upper left hand corner of each panel; the percentage of all IgMa positive cells that are also IgMb positive is shown in the upper right hand corner of each panel. The percentage of all IgM positive cells that are IgMb only positive ranged from 0 to 1.9%. An example of how the quadrants were defined is shown for the 518 sample. Part B is derived from 8 experiments: (1) 501, 501Δ, 522, and 522Δ. (2) 923 and 923Δ. (3) 925 and 925Δ. (4) 336 and NTg. (5) 410 and 410Δ. (6) 934, 934Δ, 835, 835Δ, and 912. (7) 518. (8) 418, 842 and 842Δ. C. Expression of LPS-induced (3 day cultures) VDJCμ transcripts and HPRT transcripts was tested by two or three five-fold dilutions of cDNA by semi-quantitative RT-PCR. These cDNA samples were tested in three (HPRT) or four (VDJCμ) experiments, and the gel images were re-organized to construct this figure. For each transgenic line (indicated above the gel images, the version before Cre-mediated deletion is shown in upper set of VDJCμ and HPRT samples, and the version after Cre-mediated deletion (“Δ”) is shown in the lower set. The grey line between the “water” and left-most “522” HPRT sample indicates that the “water” lane was moved from a different location on the same gel as the “522” samples with which it was originally tested.

