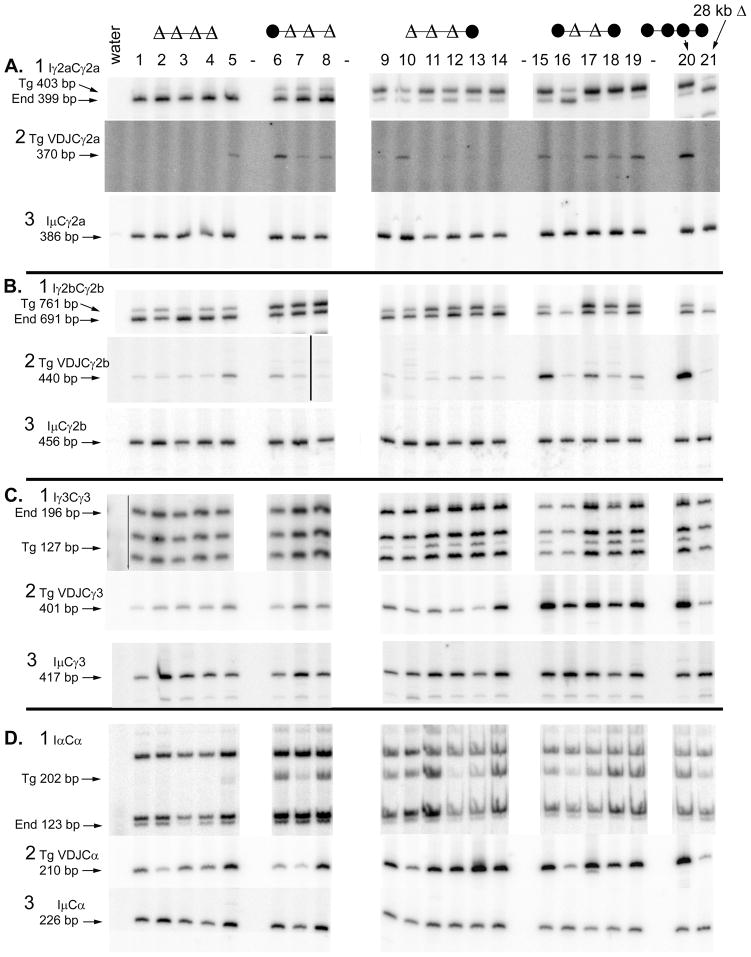
FIGURE 3.
Expression of germline and post-switch transcripts. The composition of the 3′ enhancer region is shown schematically above the lane numbers for each set of transgenes. Heavy chain mRNA expression was analyzed after three days of culture with the indicated B cell activators and cytokines. A. γ2a B. γ2b C. γ3 D. α. In each panel, B cells from the following transgenic lines were tested: lane 1, 934Δ; lane 2, 842Δ; lane 3, 923Δ; lane 4, 835Δ; lane 5, 925Δ; lane 6, 501Δ; lane 7, 522Δ; lane 8, 410Δ; lane 9, 934; lane 10, 912; lane 11, 842; lane 12, 923; lane 13, 835; lane 14, 925; lane 15, 501; lane 16, 522; lane 17, 418; lane 18, 410; lane 19, 518; lane 20, 820; and lane 21, 820Δ. Within each type of transgene, this arrangement places single copy transgene to the left and higher copy numbers to the right, with some exceptions (for example, lines 410 and 518 are reversed relative to their JH copy number). The same lane designations are used in subsequent figures. In subpart 1 of each Part, total germline transcripts were amplified by RT-PCR and digested with a restriction enzyme that allows transcripts of the endogenous and transgenes to be distinguished. In each subpart 1, the germline transcripts for lanes 1–8 and 9–21 were tested in separate experiments. In subpart 3 of each Part, the concentration of each cDNA was adjusted so that the amount of Iμ transcripts would be approximately equal, and then the same concentration of cDNA was tested for transgenic VDJ transcripts in subpart 2 of each Part. In Fig. S2, it is demonstrated that these RT-PCR are in the semi-quantitative range, and more complete quantification of some of the samples is shown.

