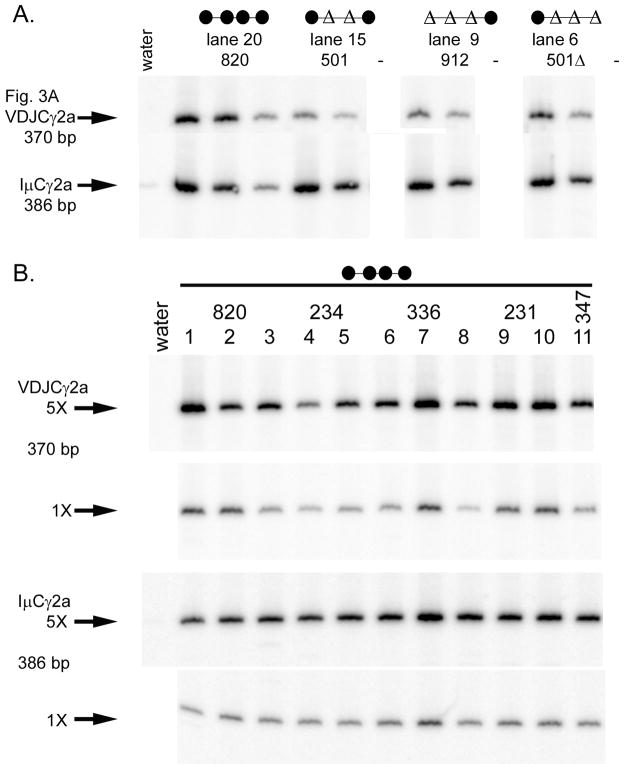
FIGURE 4.
Semi-quantitative RT-PCR analysis of γ2a post-switch transcripts. A. cDNA samples from Fig. 3A, subparts 2 and 3, were amplified using the same cDNA concentration used in Fig. 3A and two additional five-fold dilutions (line 820 samples) or one additional five-fold dilution (other three samples). Lane numbers corresponding to Fig. 3A and transgenic line founder numbers are listed at the top. Empty lanes are indicated by dashes. B. cDNAs from wild type ARS/Igh transgenes (line 820, 1 copy, lanes 1–3; line 234, 2 copies, lanes 4–5; line 336, 2 copies, lanes 6–8; line 231, 3 copies, lanes 9–10; and line 347, 3 copies, lane 11) were first balanced for IμCγ2a expression. Then both VDJCγ2a and IμCγ2a transcripts were tested at identical “5x” and “1X” concentrations of the cDNA. Different lanes from the same transgenic line represent cDNAs from independent B cell cultures.

