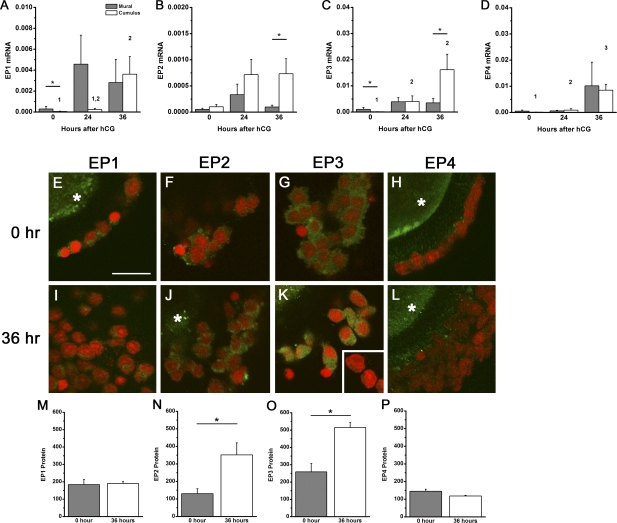
FIG. 2.
EP receptors in cumulus and mural granulosa cell subpopulations. EP1 (A), EP2 (B), EP3 (C), and EP4 (D) mRNAs were quantified within cumulus and mural granulosa subpopulations obtained before (0 h), 24 h after, and 36 h after hCG administration. Each EP mRNA was expressed relative to β-actin. Data are expressed as mean ± SEM, n = 3–6 monkeys per time point. Within each panel, each subpopulation was assessed by ANOVA, followed by Duncan; groups with no common superscripts are different (P < 0.05). Comparisons between subpopulations were performed using a paired t-test (*P < 0.05). E–L) Immunofluorescent detection (green) of EP1 (E and I), EP2 (F and J), EP3 (G and K), and EP4 (H and L) in cumulus granulosa cells obtained before (0 h; E–H) and 36 h after (I–L) hCG administration. Granulosa cell nuclei are red (propidium iodide staining). When visible, immunofluorescence reflecting presence of the oocyte in the image is indicated by an asterisk. Specific EP immunodetection in monkey oocytes was previously reported [14]. Absence of green fluorescence was confirmed when primary antibody was omitted (K, inset) or primary antibody was preabsorbed with the peptide used to generate the antibody (data not shown). All images are at the same magnification; bar in E = 20 μm. Protein levels for EP1 (M), EP2 (N), EP3 (O), and EP4 (P) are expressed as mean ± SEM (n = 3 animals per time point). Comparisons between time points were performed using an unpaired t-test (*P < 0.05).

