
Fig. 4.
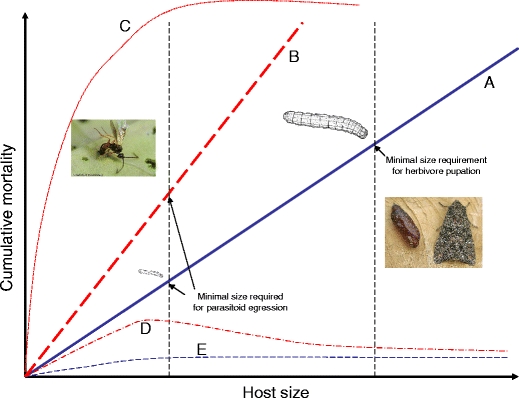
Conceptual diagram showing the relationship between herbivore (healthy or parasitized) growth curves and cumulative mortality on food plants that differ in their quality. Solid line a and short dashed line e represent herbivore growth curves on non-induced plants; long dashed line b, dotted line c and alternating dot-dashed line d lines represent herbivore growth curves on induced plants. In this example, the parasitoid is solitary and the host caterpillar must reach a much smaller critical size to support parasitoid development (left dashed black vertical line) than to successfully pupate (right vertical black dashed line). In this study, induction steepens the mortality curve (lines a, b) reducing survival of both the parasitoid and the herbivore; the latter does not survive at all on induced plants because it cannot grow large enough to reach a minimum viable size for pupation. If the plant is even more toxic, then the parasitized host does not even reach a critical size and all parasitoids die before egression form the host (line c). In some instances, perhaps due to stress caused by parasitism, parasitoids may experience higher mortality on induced plants than their hosts (line d), or else herbivore and parasitoid mortality on non-induced plants does not differ (line e). Many different combinations are possible, depending on the effects of the plant on the herbivore and parasitoid, the parasitoid on the herbivore, and quantitative differences in the required growth of healthy and parasitized hosts