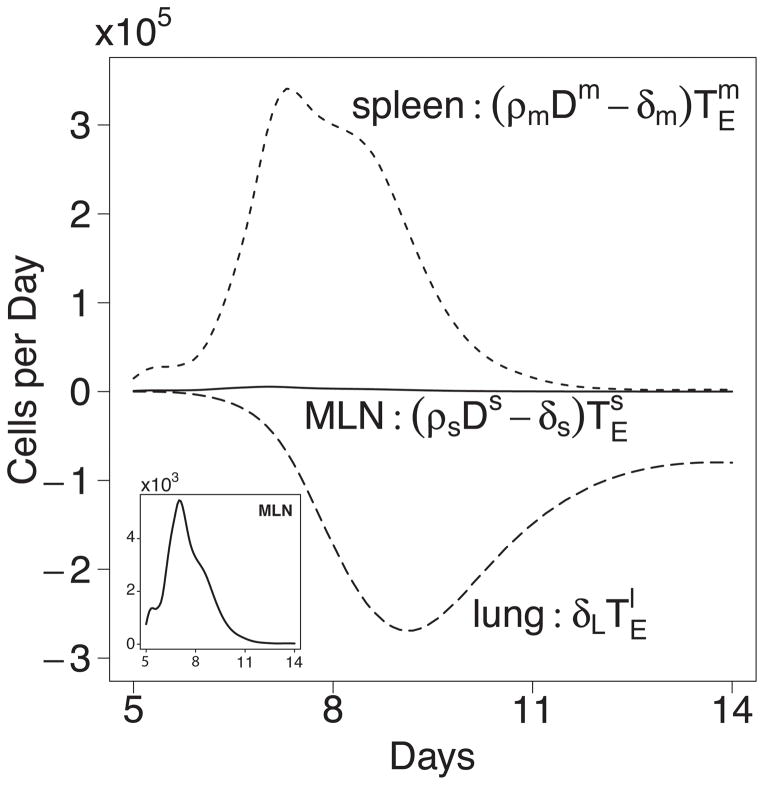
Figure 5.
Net population growth/loss rates at different sites. Estimated number of cells gained or lost per day in MLN, spleen, or lung using model 4 and the parameters from Table II. Results for MLN are also plotted on a two log lower (103 vs 105)scale in the inset to better visualize the change in growth rate over time.

