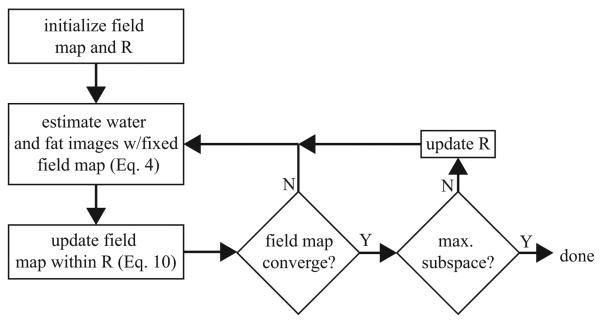
Figure 2.
flowchart of the proposed estimation process; the field map is initialized to zero and the restricted subspace R is initialized as in Figure 1a; the water and fat images are estimated with the fixed field map; the field map is then updated in the restricted subspace R; this process is continued until the field map update is small; R is then eased to span a larger dimension and the entire process is repeated until a predefined stopping point is reached.

