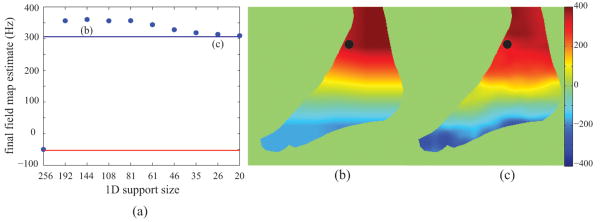
Figure 8.
(a) the field map estimate at 2×-acceleration for the voxel denoted by the black dot in (b) and (c) as a function of 1D support size; the red line and blue line indicate the field map estimate using 1× IDEAL-VI and 1× IDEAL-RG, respectively; (b)-(c) the evolution of the field map image estimate at two different support sizes as denoted in (a); the two field map images use the same colorbar, which is in units of Hertz (Hz);

