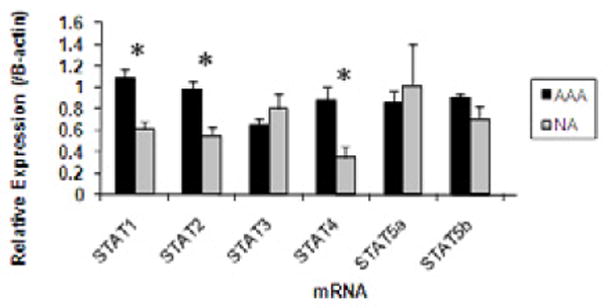
Figure 1.

Graphic representation of aortic STAT mRNA obtained from AAA (black bars) or NA (gray bars). STAT mRNA expression was assessed by real time RT-PCR and normalized to β-actin and is expressed in arbitrary units (AU). STAT1, 2, and 4 mRNA were significantly elevated in samples obtained from AAA compared to NA. * P<0.05.
