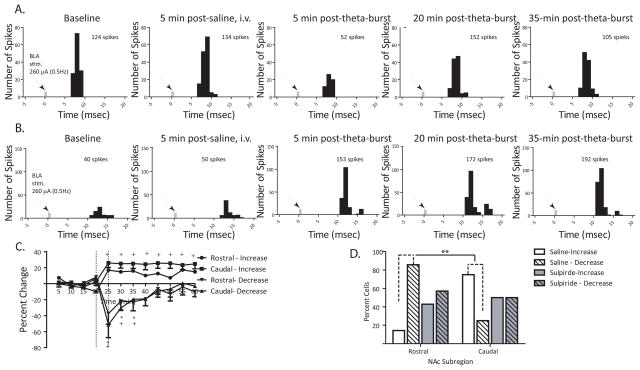
Figure 2.
Subregions of the NAc demonstrate differential levels of plasticity in response to BLA theta burst stimulation (A) Representative peristimulus time histogram (5 minsamples, 150 sweeps) illustrating short-duration decrease in BLA-evoked responses in NAc following theta burst stimulation of the BLA, (B) Representative peristimulus time histogram (5 min samples, 150 sweeps) illustrating long lasting potentiation of BLA-evoked responses in NAc following theta burst stimulation of the BLA, (C) Mean percentage change (± SEM) of the BLA-evoked spike probability in the rostral and caudal subregions of the NAc normalized to the baseline spike probability before saline injection and theta burst (time of injection and stimulation represented by vertical lines), (D) Bars represent the number of neurons in rostral and caudal subregions of the NAc exhibiting either an increase or decrease in BLA-evoked responses following saline or sulpiride administration (5 mg/kg, i.v.) and subsequent BLA theta burst. (* denotes p<.05 for rostral neuron responses compared to baseline, + denotes p<.05 for caudal neural responses compared to baseline, repeated measures ANOVA, Holm-Sidak post-hoc; **denotes p<.05 for rostral vs caudal comparisons after saline injection, Fisher exact test)

