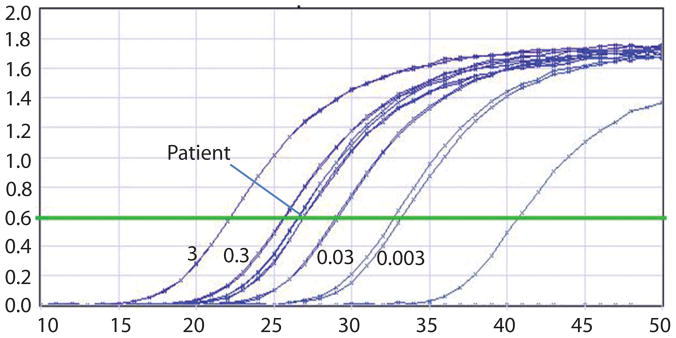
Figure 3.
Representative real-time quantitative PCR curves showed the amplification of E7 of HPV16. Standard curves were generated with series dilution of DNA (ng) from Caski cells. The samples have been normalized for DNA equivalence using actin dilution curves (data not shown). The X axis represents the PCR cycle number as the reaction takes place.

