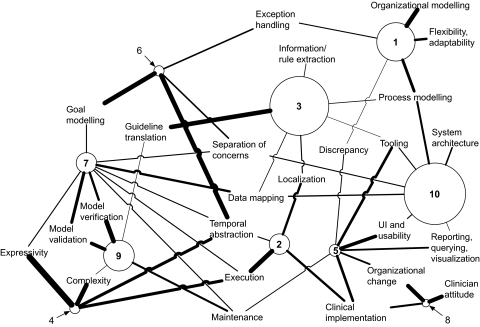
Figure 2.
Concept map derived from RefViz Galaxy and Matrix analysis, showing association between study clusters and the ‘challenge theme’ variables. The radius of each circle is proportional to the number of studies in the cluster; the thickness of the line between cluster and theme is proportional to the strength of association between the cluster and the theme.

